Latest briefs Browse latest →
Gas Prices and Inflation, Explained
May inflation reaches 4.2% as a gas price board raises costs for drivers, families, and household budgets
Full visual brief
Follow the story
Sources & verification
Reporting behind this brief, checked before publication.
Brief text
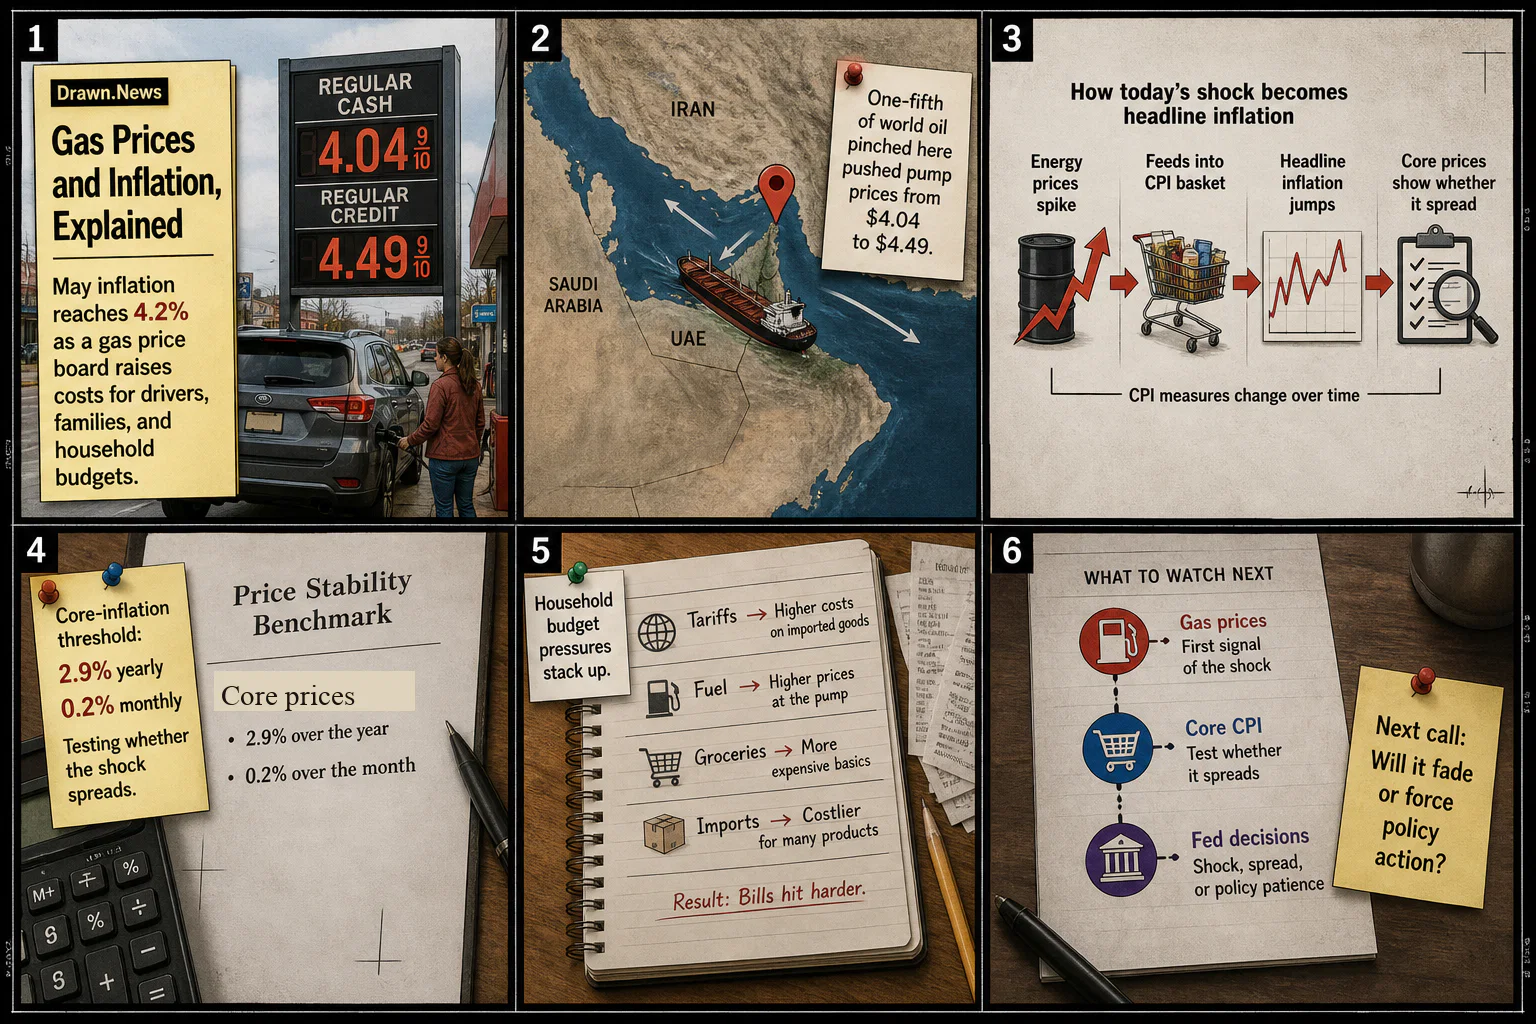
Rising gas prices pushed May consumer prices up 4.2% from a year earlier after the Strait of Hormuz closure squeezed oil supply and pump prices.
- Frame 1May inflation reaches 4.2% as a gas price board raises costs for drivers, families, and household budgets.
- Frame 2A Hormuz supply map shows one-fifth of world oil pinched, pushing pump prices from $4.04 to $4.49.
- Frame 3The CPI chain turns volatile energy into headline inflation before slower core prices reveal whether it spread.
- Frame 4The core-inflation threshold was 2.9% yearly and 0.2% monthly, testing whether the shock spreads.
- Frame 5A household ledger stacks tariffs, fuel, groceries, and imports, showing why basic costs feel heavier.
- Frame 6The watch timeline is gas, core CPI, then Fed decisions: shock, spread, or policy patience.
How this was checked
- Reporting
- Cross-checked across 2 sources
- Claims
- We checked the names, dates, numbers, and core facts against the reporting linked above
- Artwork
- This is an editorial illustration based on the reporting, not source photography
- Published
- Jun 10, 6:17 PM EDT
- Our standards
- Editorial standards and corrections