Latest briefs Browse latest →
Inflation reports turn sampled prices
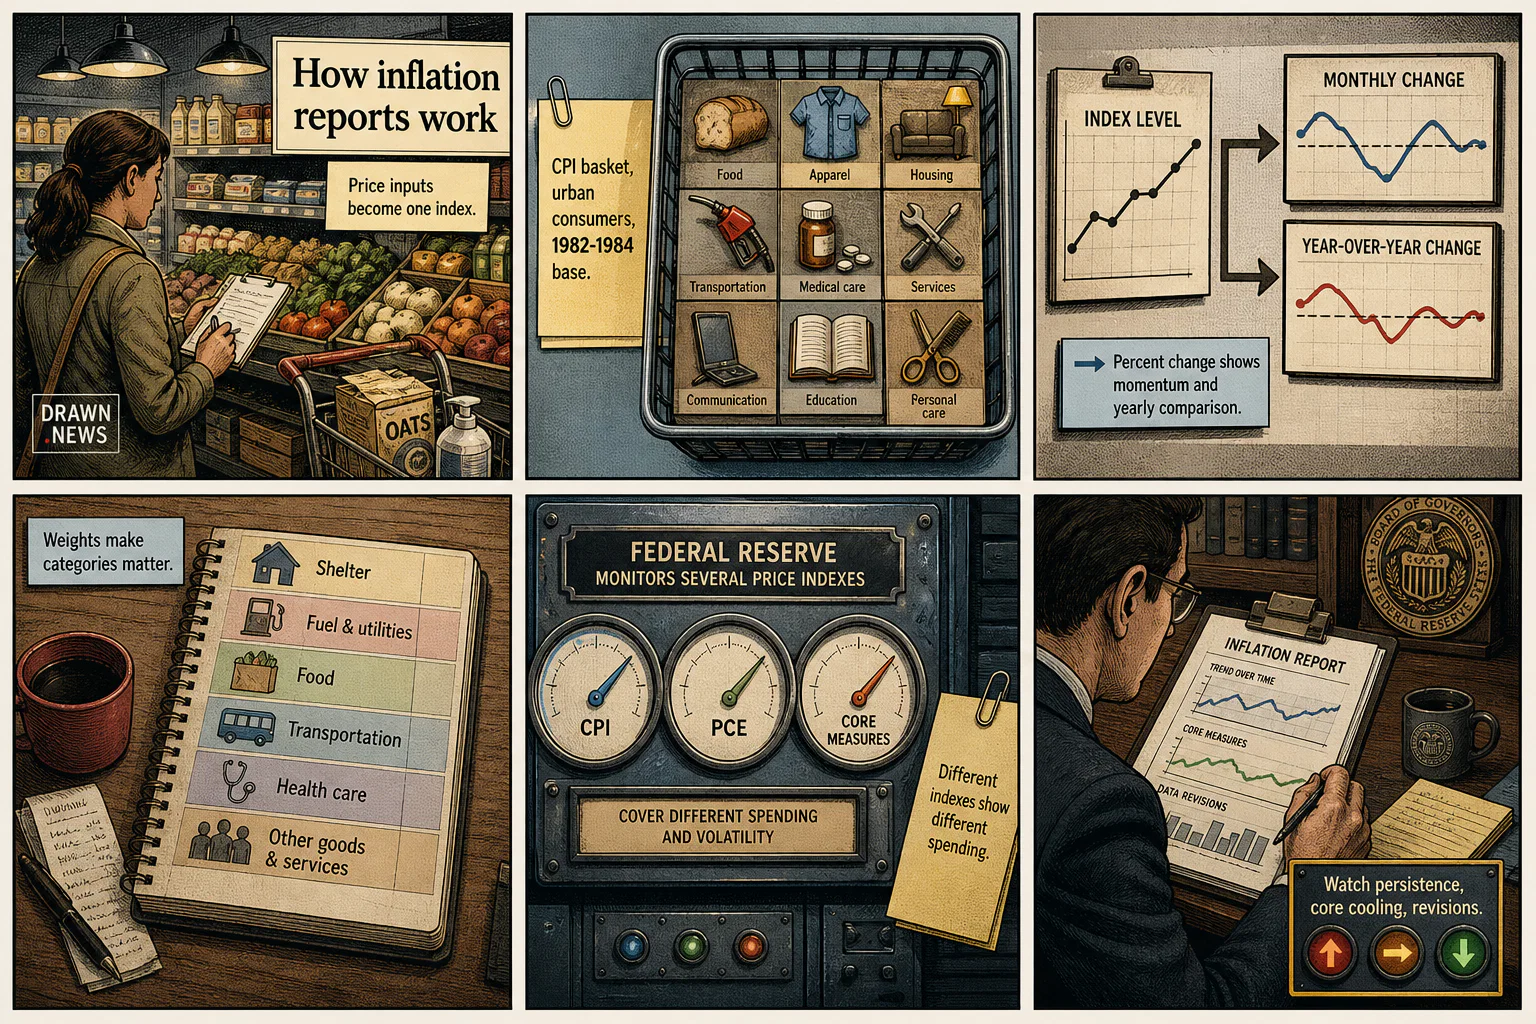
Inflation reports turn sampled prices into indexes, monthly changes, annual rates and pressure points for households, markets and the Federal Reserve.
Full visual brief
Follow the story
Sources & verification
Sources behind this guide, checked before publication.
Brief text
Inflation reports turn sampled prices into indexes, monthly changes, annual rates and pressure points for households, markets and the Federal Reserve.
- Frame 1Price-board inputs turn household market prices into a monthly index, so one costly item cannot define inflation.
- Frame 2The CPI grid tracks goods and services paid by urban consumers against the 1982-1984 base.
- Frame 3A timeline converts index levels into monthly momentum and year-over-year headline inflation.
- Frame 4A household ledger shows weights: shelter, fuel, food, fares, fees and taxes hit budgets differently.
- Frame 5A Fed policy meter compares CPI, PCE and core measures because coverage and volatile items differ.
- Frame 6Watch the trend path: persistent price jumps, cooling core measures, or revisions that change the signal.
How this was checked
- Reporting
- Cross-checked across 2 sources
- Claims
- We checked the names, dates, numbers, and core facts against the reporting linked above
- Artwork
- This is an editorial illustration based on the reporting, not source photography
- Published
- Jun 11, 8:19 AM EDT
- Our standards
- Editorial standards and corrections